Shopify Analytics Tools for Ecommerce Sellers
Shopify analytics reports with FIFO economics on orders, fees, refunds, and shipping — a shopify analytics dashboard for DTC teams who outgrew the native storefront
- Accounting
- Inventory
- Forecasting
- AI access

Trusted by 200+ ecommerce teams


Why Shopify Sellers Need NeonPanel Analytics Software
Native Shopify analytics covers the storefront; NeonPanel adds batch landed cost, inventory, and accounting on one ledger so profit, replenishment, and finance stay aligned as you add 3PLs or channels.
Whether you run one shopify store or a multi-location stack, analytics for shopify should tie sales analytics to true profit — not gross revenue alone. NeonPanel shopify analytics integration keeps product analytics and customer analytics on the same ledger your controller recognizes.
Profit by SKU
See true contribution after fees, refunds, shipping, and FIFO COGS — product analytics and sales analytics per variant, then cut assortments that look busy but lose money.
Inventory by location
Shopify store analytics for days-of-cover and stock health per variant across locations and 3PL nodes feed the next PO without another export.
Customer demand signals
Customer analytics with cohort repeat, LTV bands, and channel-attributed spend land beside order economics so marketing rebids on facts.
The boundary line. Native reports say what sold; NeonPanel says what it earned, what it cost, and what to reorder next.
Shopify Analytics Reports Turning Data Into Actionable Growth
NeonPanel shopify analytics reports sit on the same orders, fees, refunds, and FIFO batches your books use — one current dataset for planners, marketers, and finance. Your shopify analytics dashboard and analytics for shopify views share sales analytics the CFO can defend, with a reports overview that updates as checkout, shipping, and returns post.
Sales and margin
Sales analytics for revenue, units, AOV, and contribution margin by product and channel refresh continuously for weekly trading reviews.
Inventory and sell-through
Days-of-cover, velocity tiers, and overstock flags tie replenishment to forward demand instead of gut feel.
Customer and cohort
Customer analytics with repeat curves, LTV bands, and paid versus organic contribution guide budget shifts without another BI sheet.
Fulfillment and returns
Checkout and shipping economics plus refund patterns surface SKUs or carriers quietly draining margin.
Each slice of the reports overview rolls up to the same shopify analytics dashboard finance signs off on, so shopify analytics reports stay aligned with analytics for shopify views from checkout through fulfillment.
Need multi-channel inventory analytics? Open the Inventory Analytics hub.
Shopify Ecommerce Analytics That Drive Smarter Store Decisions
Store decisions need contribution margin finance recognizes — not gross sales from the native dashboard. NeonPanel ties Shopify orders, fees, and FIFO COGS to the same ledger as Amazon, wholesale, and TikTok.
| Signal | NeonPanel read | Store decision |
|---|---|---|
| Collection margin | True profit after fees, shipping, and FIFO COGS | Promote winners; pause collections leaking margin |
| Variant velocity | Sell-through and days-of-cover per SKU | Reorder on real pull, not weekly guesses |
| Return rate | Refund patterns tied to listing and carrier | Fix quality or copy before ads scale bad SKUs |
| Channel contribution | Margin by storefront, marketplace, and wholesale | Shift spend to channels that clear contribution hurdles |
Live data for AI. NeonPanel MCP exposes the same ledger to Claude, Cursor, or custom agents — replenishment and margin answers from checkout and shipping data, not stale exports.
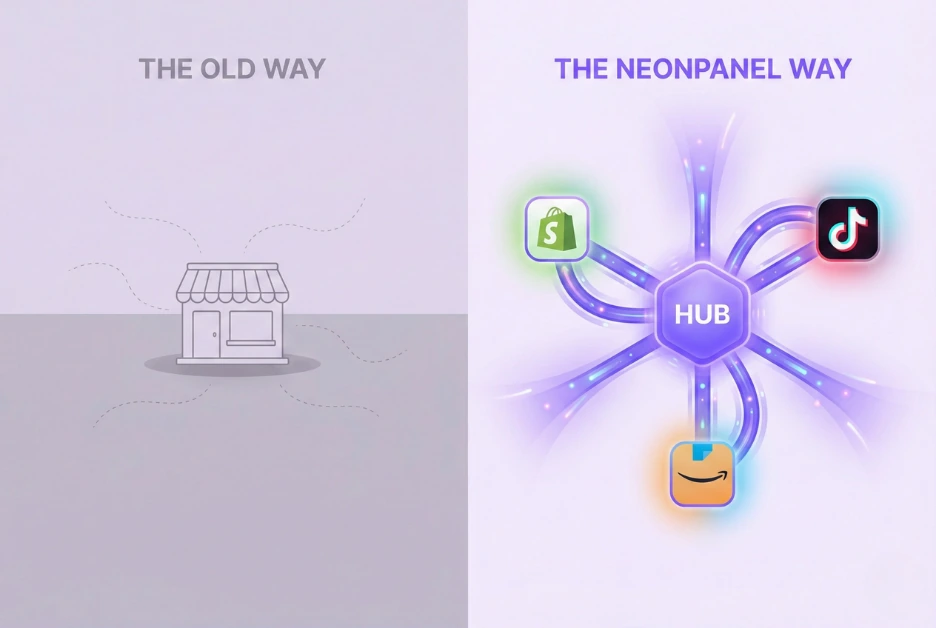
What Changes When You Layer NeonPanel On Top of Shopify
Native Shopify stays at storefront metrics; NeonPanel adds FIFO economics, inventory risk, and automated accounting on every order. Shopify analytics integration replaces manual CSV cycles with continuous shopify analytics reports — one shopify analytics dashboard for ops, marketing, and finance.
Profit basis
Before NeonPanelAverage cost, fees often missing
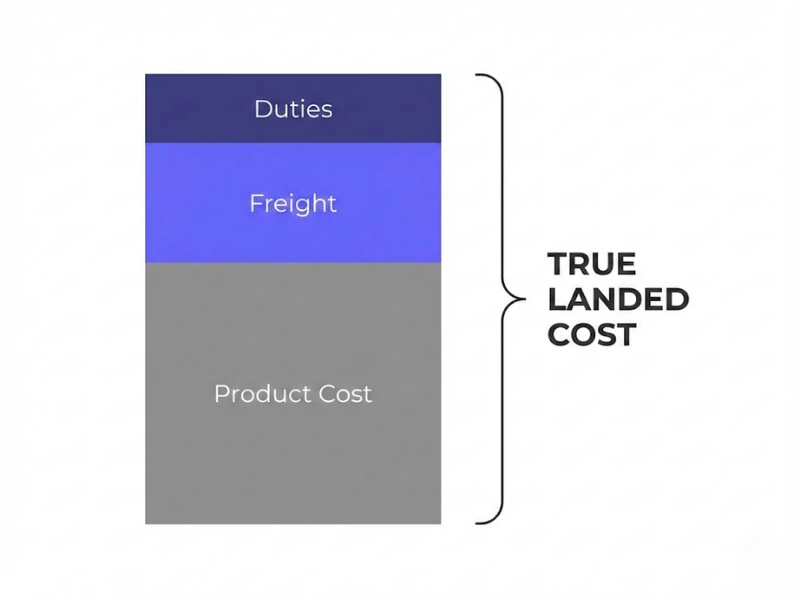
After NeonPanelTrue FIFO landed cost, fees netted
Product analytics
Before NeonPanelTop sellers list only
After NeonPanelVelocity, margin, days-of-cover per variant
Multi-channel
Before NeonPanelShopify orders siloed
After NeonPanelShopify plus Amazon, TikTok, wholesale
Accounting
Before NeonPanelManual CSV handoffs
After NeonPanelJournals on the same heartbeat
Where Shopify Analytics Connects
Shopify analytics is one altitude in NeonPanel's operating stack. Sales analytics, product analytics, and customer analytics on every shopify store share the same ledger as Amazon and 3PL data below.
Inventory Analytics →
Turnover, days-of-cover, and demand signals across warehouses.
Amazon Analytics Tools →
Brand Analytics and marketplace economics beside Shopify.
Inventory Management →
Batch landed cost and stock positions feeding every chart.
Forecasting & Replenishment →
Reorder math and stockout risk on live Shopify data.
How NeonPanel Works →
Foundation through Augmentation on one operating stack.
Pricing & Plans →
Plans, Forecasting add-on, MCP access, and estimator.
Four channels for the same instrument layer
NeonPanel's structured ledger, batch-level COGS, and shipment-level inventory reach your team through MCP, Claude, Slack agents, or Viktor. Pick the surface that matches how you work.
Direct MCP
Build custom agents in Cursor, Claude Code, or your own stack against the NeonPanel MCP server.
Set up MCP → For analysts & operatorsClaude plugin
Eight specialist agents in Claude Code or Cowork — routing and MCP tools included.
Connect Claude → For teams in SlackAgents in Slack
@mention Dorian, Marta, Nina, and the full default roster directly in Slack — same agents as Claude.
Open Slack agents → General coworkerViktor in Slack
One @mention for routing — Viktor picks the domain when you prefer not to choose an agent.
Meet Viktor →Recommendations land on real FIFO batch costs, not industry averages.
Frequently Asked Questions
A shopify analytics dashboard is one screen for revenue, conversion, behavior, product performance, inventory, and profit. NeonPanel ties each analytics for shopify view to FIFO landed cost, Shopify fees, refunds, and shipping — the metrics your team reads match what finance can defend.
Orders become operating decisions: sales analytics, customer analytics, and product analytics share the inventory and accounting ledger, so reorders, marketing throttle, and pricing land on real profit per order on every shopify store SKU, with batch-level audit trail.
Shopify store analytics with sales, cohorts, product and checkout views, attribution, profit per order, FIFO COGS, shipping and returns, multi-warehouse turnover, and forecast-driven replenishment. Website analytics and ecommerce tracking roll into the same reports overview your CFO and MCP agents (Claude, Cursor, or custom) query.
Yes. Shopify analytics integration sits on NeonPanel's multi-channel ledger with Amazon, TikTok, wholesale, and 3PL data. Analytics shopify views share sales analytics with marketplace reporting; journals sync to QuickBooks or Xero, MCP exposes the dataset to ai analytics platforms, and Viktor surfaces answers in Slack.
Decisions improve when marketing, planning, and finance reference one number per question. NeonPanel shopify analytics reports tie to orders, fees, refunds, shipping, and batch costs so a promotion's cash impact is visible before you run it — the same shopify analytics dashboard updates as checkout and returns post, not only later in the P&L.
Bring NeonPanel into your stack
14-day free trial. No credit card. Dedicated onboarding on every plan — we set up your batches, your ledger, and your channels with you.
Join 200+ ecommerce teams who trust NeonPanel for their financial close.