Inventory forecasting and planning
Demand forecasting from history, plus growth and promo overrides you control — replenishment stays on the same ledger as ops and finance
Unified system
- Accounting
- Inventory
- Forecasting
- AI access

Trusted by 200+ ecommerce teams


Why Brands Trust NeonPanel for Forecasting
Automatic Forecast Baseline
Loads 12+ months of history by default (longer when available) and builds the statistical baseline automatically.
You Set the Growth
Override the baseline with your own growth multipliers per SKU.
Plan Promotions
Tag launches, flash sales, and campaigns so lifts sit in the forecast, not only in hindsight.
Cash Flow Clarity
See capital in stock, reorder timing, and how supplier payments line up with incoming revenue.
NeonaSphera agents run on your NeonPanel data; Inventory Manager can refresh forecasts from your inputs and return replenishment timing and quantities by channel.
Inventory Planning That
Reflects Reality
Layer promos, launches, and growth plans on the statistical baseline so forward weeks reflect what you intend to run, not only what already happened.
- Default lookback: at least 12 months per integrated channel (longer when available)
- Monthly model refresh to track actuals
- Your growth multipliers per SKU
- Plan vs actual each cycle
- QuickBooks / Xero on the same cadence
using proactive demand forecasting
How Inventory Forecasting & Planning Works
Baseline from your data; strategy from you. Outputs: what to order, when, and how much.

Forecasting Inputs: Data + Your Knowledge
NeonPanel combines automated statistical forecasting with the business context only you can provide.
| Input Type | How It Works | Best For |
|---|---|---|
| Demand Forecast Baseline | Statistical modeling from historical sales per channel, with a 12-month minimum lookback by default | Established products with consistent sales history |
| Monthly Model Refresh | Baseline recalculated monthly so forecasts stay in sync with actual performance | All SKUs—prevents forecasts from drifting away from reality over time |
| Growth Projections | You set growth % per SKU to override the statistical baseline | Scaling products, new market entries, aggressive growth phases |
| Promotion Calendar | Tag sales events, launches, and campaigns with expected lift % | Flash sales, Prime Day, influencer drops, product launches |
| Lead Time Buffer | Supplier production, freight, and FBA check-in windows in the math | Overseas sourcing and variable inbound legs |
Where this fits on the ladder
Anticipation adds forecasting and replenishment on the same FIFO costs and velocity that close the month — not spreadsheet estimates.
Anticipation on the ladder: needs Accounting Automation (Foundation) and Inventory Management (Resolution) so planning acts on the same operational truth.
F&R adds reorder timing and shipment-aware runs; shipment-level economics require Professional.
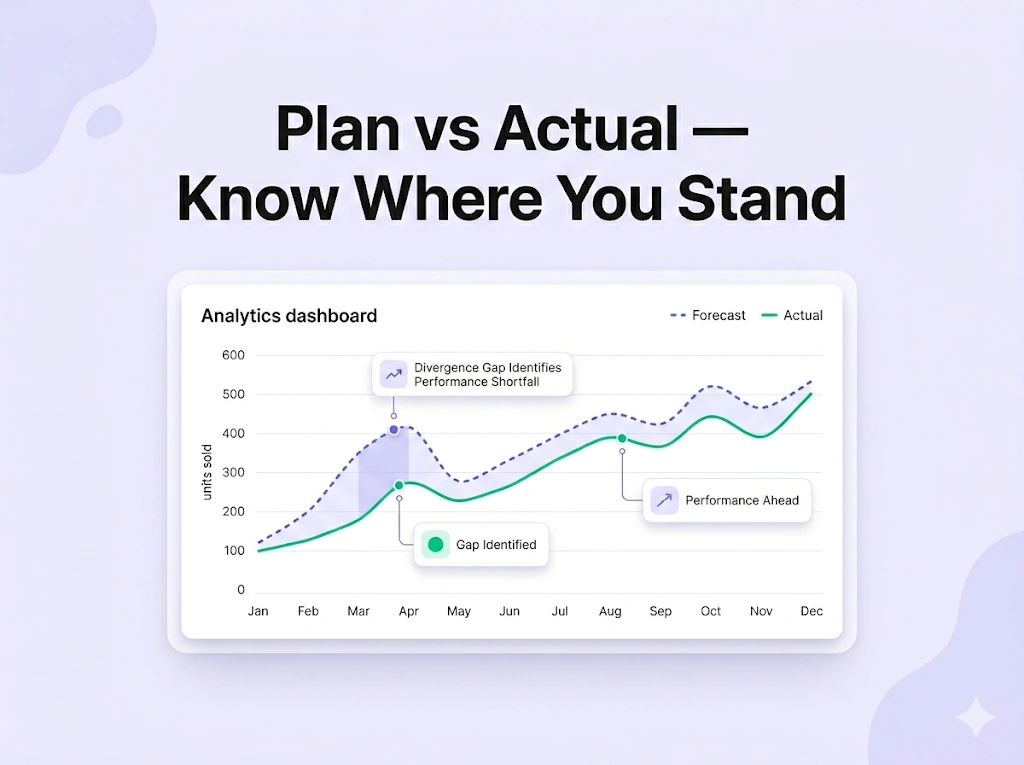
Plan vs Actual:
Learn from Every Cycle
Compare planned units to actuals per SKU and channel; monthly refresh keeps the baseline honest.
- Forecasted vs actual units per SKU
- Over- and under-forecast by channel, season, or promo
- Each cycle feeds the next
- Monthly model refresh

Why Inventory Forecasting Software
Beats Spreadsheets
At scale, spreadsheets lag saves; NeonPanel keeps baselines live with monthly refresh and channel sync.
- Continuous channel data vs static sheets
- Monthly baseline recalibration
- High SKU counts without formula sprawl
- QuickBooks / Xero aligned to the same forecast
Demand, supply, and buy timing together
One system ties what should sell to when inventory lands and when to pay suppliers — fewer stockouts, less idle cash in the wrong SKUs.
- Statistical baseline plus launches and promos you define
- Plan vs actual plus refresh so projections stay honest
- Amazon, Shopify, wholesale, and the ledger in one place
Demand forecasting and automated replenishment on one ledger — finance-grade numbers for how much to buy and when.
Three channels for the same instrument layer
NeonPanel's structured ledger, batch-level COGS, and shipment-level inventory are exposed to your AI through three channels. Pick the one that matches how your team works.
Direct MCP
Build custom agents in Cursor, Claude Code, or your own stack against the NeonPanel MCP server.
Set up MCP → For analysts & operatorsClaude plugin
Connect NeonPanel to Claude Desktop in one click and ask questions about your real data in plain language.
Connect Claude → For founders & teamsViktor in Slack
Ask Viktor for FBA replenishment, profitability, and forecasting answers without leaving Slack.
Meet Viktor →Recommendations land on real FIFO batch costs, not industry averages.
Frequently Asked Questions
At least 30 days for an initial demand forecasting baseline. For seasonality modeling, we recommend 12+ months of sales history.
Yes. QuickBooks Online and Xero integration is included in all Professional plans, supporting a seamless inventory forecasting system.
Absolutely. NeonPanel aggregates data from Amazon, Shopify, TikTok Shop, and Walmart for unified forecasts. Using advanced inventory forecasting techniques, the platform delivers consistent, unified insight across your entire go-to-market footprint.
You can tag any future promotional period—sales, launches, influencer campaigns—and specify expected lift. The system adjusts inventory needs accordingly, based on sales projections. This is crucial because historical data cannot predict what you are planning.
Yes, through NeonaSphera—structured AI agents powered by your NeonPanel data. The Inventory Manager agent can model forecast changes, update projections based on your inputs, and output replenishment recommendations that tell you when to order and how much to send to each channel. Learn more at neonasphera.com.
Bring NeonPanel into your stack
14-day free trial. No credit card. Dedicated onboarding on every plan — we set up your batches, your ledger, and your channels with you.
Join 200+ ecommerce teams who trust NeonPanel for their financial close.