Inventory Management Analytics Software
Advanced inventory analytics software on live Amazon, Shopify, and 3PL data — inventory and sales analytics ops, planning, and finance share for every product and batch
- Accounting
- Inventory
- Forecasting
- AI access
Trusted by 200+ ecommerce teams


Why Choose NeonPanel for Inventory Analytics
Inventory optimization analytics belongs on one row: shelf position, landed cost, and sell-through. NeonPanel ranks SKUs by turnover, contribution margin, and days-of-cover so capital at risk is visible before discounts or POs — one ledger ops and finance both defend.
Multi-channel ecommerce businesses need advanced inventory analytics that tie sales velocity to true FIFO cost. Inventory optimization analytics on NeonPanel replaces spreadsheet turnover math with live product-level signals your business can audit.
vs spreadsheet-driven inventory and sales reporting workflows for ecommerce operators.
on true FIFO batch costs (5 Stars United, ~$30M ARR).
on month-end accounting backed by the same ledger.
Immutable batch and movement history for every product.
Margin-aware velocity
Sales velocity (7/30/90-day windows) paired with margin-after-fees, so a fast-moving product is never mistaken for a profitable one.
True FIFO inventory turnover
Inventory turnover and days-of-cover are computed on the actual batches that filled the bin, not blended averages — inventory turnover analytics tools on real receipts.
Live overstock register
Automation surfaces overstock and stockout candidates against forward demand, before storage fees compound on slow product lines.
Inventory Management for Predictive Analytics
Predictive inventory needs batch-level cost, clean multi-channel history, and lead-time-aware demand. NeonPanel combines them into per-SKU forward curves with confidence bands you can inspect before a PO — predictive analytics for inventory optimization when your team wants model-assisted reorder scenarios, not spreadsheet guesses.
Reorder quantity
Suggested buys tuned to your service-level target and inbound timing per product.
Stockout risk
Weekly risk scores per SKU with the velocity and lead-time inputs surfaced for ecommerce and marketplace lines.
Overstock candidates
Slow movers flagged early so storage fees do not compound quietly across the business.
Inventory turnover analytics tools and forecast bands share the same batch assumptions. Drill the math, then route approvals in Forecasting & Replenishment.
How Amazon Inventory Analytics Works
Amazon inventory analytics starts when FBA, AWD, reserved, inbound, and unfulfillable stock reconcile per ASIN and marketplace. Fees, ads, refunds, and returns then sit on the same contribution-margin row for every product.
Inventory turnover analytics tools score each ASIN after ingest and reconciliation — advanced automation replaces weekly spreadsheet cycles with continuous sales and turnover signals your business can defend.
SP-API pulls settlements, inbound shipments, FBA returns, AWD transfers, and removals on a steady cadence.
Each unit ties to a batch with landed cost and posts the matching journals to QuickBooks or Xero.
Inventory turnover analytics tools surface days-of-cover, velocity, and stockout risk per ASIN with sane thresholds.
Reorder, allocation, and removal recommendations show cash impact before anyone approves the move.
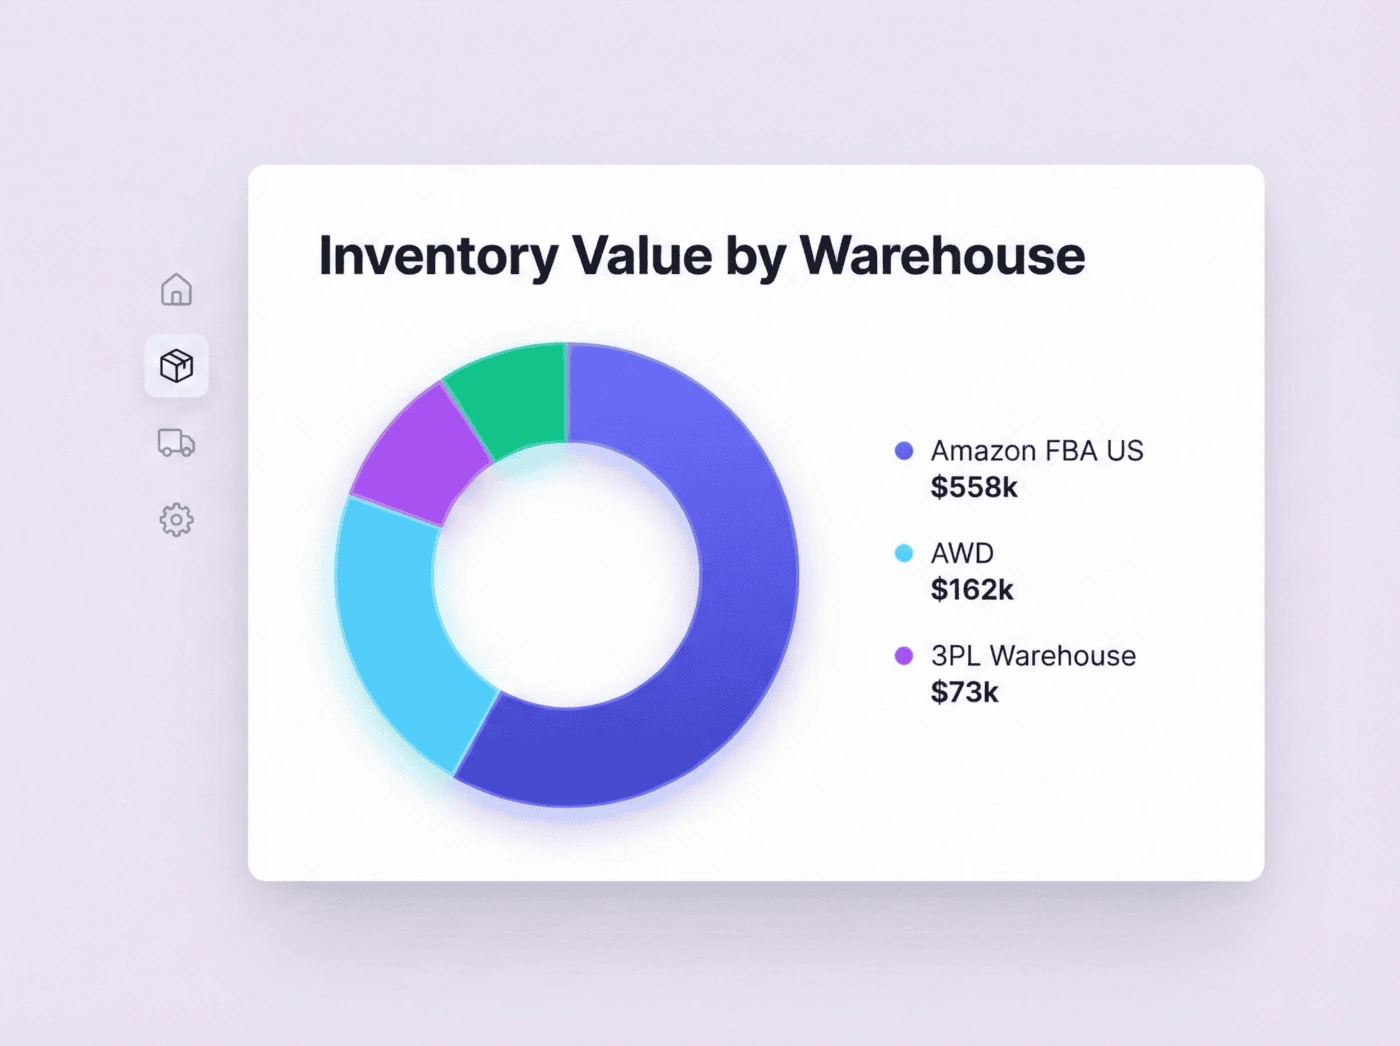
Your Live Analytics View
Inventory turnover, sales velocity, landed cost, and forward demand on one advanced analytics screen — refreshed continuously for ecommerce and marketplace SKUs, not on a weekly export cycle.

Inventory Analytics in Supply Chain
Supply chain analytics for inventory should read purchasing, receiving, in-transit, FBA inbound, AWD, and fulfillment as one timeline per SKU. Unified supply chain and inventory analytics dashboard views show capital by stage, arrivals, allocations, and cash impact in one screen—the advanced software analytics layer finance and ops both trust.
Supply chain analytics for inventory only works when automation keeps product movement, sales, and inventory turnover on one ledger. Ecommerce and Amazon FBA businesses use the same supply chain analytics for inventory views whether stock sits in a 3PL, inbound to FBA, or on shelf ready to ship.
Sync cadence
BeforeManual, daily or worse
With NeonPanelContinuous, channel-by-channel2
Cost basis
BeforeAverage cost, often stale
With NeonPanelTrue FIFO at the batch level3
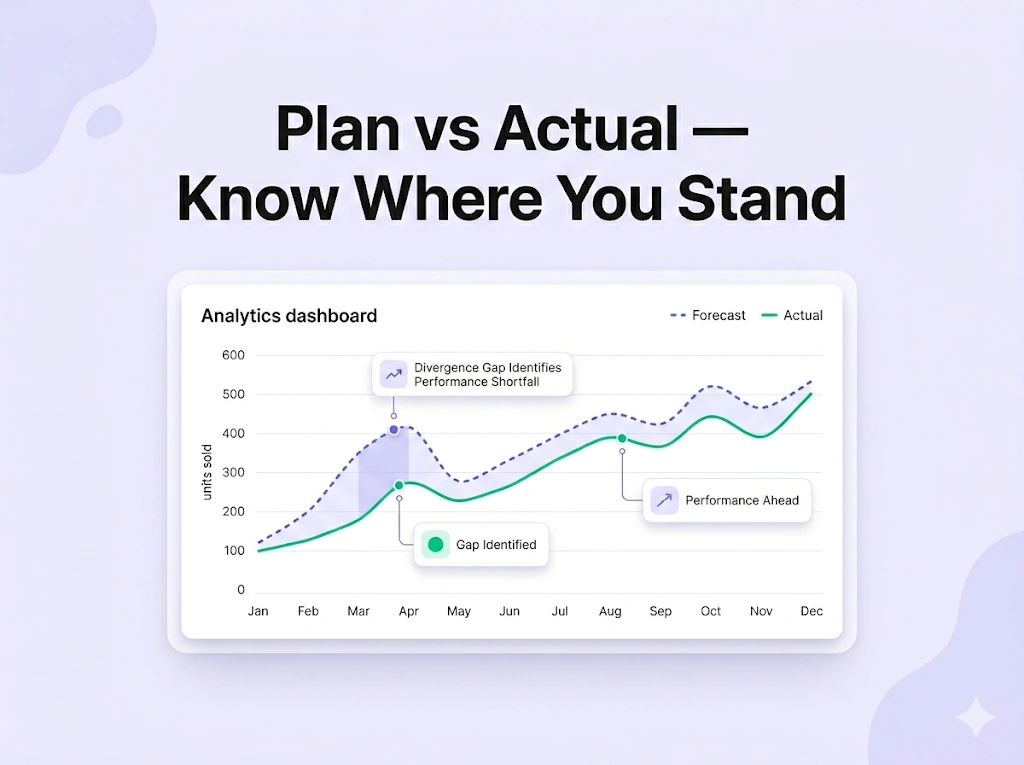
Forecast horizon
BeforeSingle-point estimate
With NeonPanelProbabilistic bands1
Reorder math
BeforeRe-keyed each Monday
With NeonPanelAuto vs service-level targets
Audit trail
BeforeTribal knowledge
With NeonPanelImmutable batch history
- Forecast benchmarks reference NeonPanel cohorts at roughly $1M–$50M annual GMV; results vary by category and channel mix.
- Sync cadence depends on each channel's API; median observed latency is under five minutes per channel.
- FIFO COGS assumes batch-level landed costs at receipt; see Inventory Management for setup.
Where Inventory Analytics Connects
Inventory analytics is one altitude in NeonPanel's operating stack. Advanced inventory optimization analytics, sales reporting, and product-level turnover roll into the same ledger as Amazon and Shopify modules below.
Inventory Management →
The module that powers every chart on this page — multi-channel stock and batch-level landed cost.
Forecasting & Replenishment →
Demand-side planning add-on. Reorder math, lead-time variance, stockout risk on real Foundation data.
Amazon Analytics Tools →
Brand Analytics, SQP purchase share, unit economics — the marketplace-side analytics hub.
Shopify Analytics Tools →
Customer cohorts, checkout funnel, profit per collection on real Shopify orders.
Amazon seller analytics tools (guide) →
Compare marketplace analytics stacks and what sellers need for true unit economics.
Inventory management software explained →
Features, benefits, and how to choose systems that scale with multi-channel stock.
Ecommerce demand forecasting workflow →
Methods, automation, and planning workflows that sit on the same analytics foundation.
How NeonPanel Works →
The four-altitude operating stack — Foundation, Resolution, Anticipation, Augmentation.
Pricing & Plans →
Essentials, Professional, and the Forecasting and MCP add-ons. Model your spend with the estimator.
Four channels for the same instrument layer
NeonPanel's structured ledger, batch-level COGS, and shipment-level inventory reach your team through MCP, Claude, Slack agents, or Viktor. Pick the surface that matches how you work.
Direct MCP
Build custom agents in Cursor, Claude Code, or your own stack against the NeonPanel MCP server.
Set up MCP → For analysts & operatorsClaude plugin
Eight specialist agents in Claude Code or Cowork — routing and MCP tools included.
Connect Claude → For teams in SlackAgents in Slack
@mention Dorian, Marta, Nina, and the full default roster directly in Slack — same agents as Claude.
Open Slack agents → General coworkerViktor in Slack
One @mention for routing — Viktor picks the domain when you prefer not to choose an agent.
Meet Viktor →Recommendations land on real FIFO batch costs, not industry averages.
Frequently Asked Questions
It tightens the link between sell-through, in-transit stock, and what must ship next. NeonPanel reconciles FBA, AWD, and 3PL continuously, uses inventory turnover analytics tools to score ASINs for stockout and overstock risk, and shows cash impact before reorder approval — so logistics runs on a current position, not stale exports.
Automation cuts manual settlement classification, batch landed-cost allocation, and spreadsheet shipment plans. NeonPanel ingests inbound data, applies true FIFO COGS as inventory lands, and drives replenishment with lead-time variance and marketplace fees in the model — advanced inventory analytics give planning time back for ops and defensible journals for finance on the same ledger.
Supply chain analytics for inventory merges demand, lead time, and on-hand into one forward view per product. NeonPanel surfaces stockout risk early and flags overstock before storage fees stack. Recommendations trace to sales velocity, inventory turnover, and batches so finance can sign off on quantity and timing.
The useful stack is threefold: current multi-channel position, true FIFO landed cost, and predictive analytics for inventory optimization that respects lead-time variance. NeonPanel delivers all three, plus MCP so agents read the same figures as planners — logistics and finance align on one ecommerce-ready dataset.
Inventory and accounting share one ledger: batch movements drive COGS, settlements post to QuickBooks or Xero, and reorders show cash impact before approval. Inventory turnover, sales, contribution margin, and days-of-cover sit on one product row so ops and finance in the same business answer the same question with the same number.
Bring NeonPanel into your stack
14-day free trial. No credit card. Dedicated onboarding on every plan — we set up your batches, your ledger, and your channels with you.
Join 200+ ecommerce teams who trust NeonPanel for their financial close.