
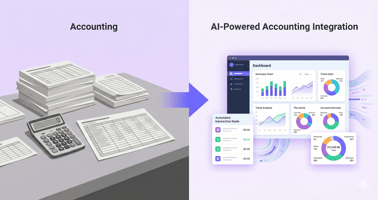
The accounting industry has always evolved alongside technological progress. From paper ledgers to...
Knowing your revenue is easy. Knowing your actual profit per product, per marketplace, per week — that is a different task entirely. This guide covers the main methods sellers use to track Amazon sales and the tools that make the process reliable at any scale.
In this article
Operators who need to track sales on Amazon accurately should build an Amazon seller dashboard that ties orders, fees, refunds, and inventory—not export-only reports. Learn how to track sales on Amazon with settlement-aware tooling finance can reconcile.
Method 1: Seller Central Native Reports
The starting point for any Amazon sales tracking setup is what Amazon already provides inside Seller Central. No extra cost, no integrations required.
- Business Reports – shows units ordered, sessions, conversion rate, and Buy Box percentage broken down by ASIN, allowing sellers to track Amazon product sales by product.
- Payments Reports — every transaction, fee, and adjustment flows through here for P&L calculation.
- FBA Reports — surface current stock, aged units, and projected storage charges.
The limitation is real: pulling meaning from these reports requires manual work. Cross-referencing three or four exports to get a clean picture of one month takes hours. It works for small catalogs, but it does not scale. For a broader look at how Amazon financial data flows into a clean P&L, see Amazon Seller Bookkeeping Guide.
Method 2: Spreadsheet-Based Tracking
For sellers with under 20 to 25 active SKUs, a well-structured spreadsheet is a legitimate tracking method. The core formula to track Amazon product sales profitability:
Net Profit = Revenue − (COGS + Referral Fee + FBA Fee + Storage Fee + Ad Spend + Returns + Other Fees)
You feed it monthly from the Payments Report export, add your cost-of-goods and ad spend manually, and the sheet gives you per-SKU profit. It is free, fully customizable, and forces you to understand every cost line.
The trade-off is time and the risk of errors when supplier costs or fee structures change and the sheet does not get updated. For sellers whose COGS varies across purchase batches — different landed costs per shipment, freight rate changes, FBA prep fees — spreadsheets consistently understate or overstate margin because they cannot track batch-level economics. See Amazon COGS Formula: A Practical Guide for Accurate Calculations for a deeper look at this gap.
Method 3: Dedicated Amazon Sales Tracking Software
This is where most sellers with growing catalogs end up. Dedicated Amazon sales tracking software connects to Seller Central via API, pulling transaction and fee data automatically, and calculates true net profit per SKU without manual work. The difference between platforms comes down to how many fee types they capture, how fresh the data is, and whether they support multiple accounts or marketplaces.
| Tool | Data Refresh | Fee Coverage | Best For |
|---|---|---|---|
| Sellerboard | 2–4 hours | 100+ fee types | Private label, detailed COGS tracking |
| Helium 10 Profits | Daily | Standard | Sellers already on Helium 10 |
| InventoryLab | Daily | Standard | Arbitrage and wholesale |
| Nova Analytics | 30 minutes | 40+ fee types | Agencies, multi-account P&L |
| Amazon Product Analytics | Near real-time | Limited | Beginners, free baseline |
Sellerboard is the most popular choice for private label sellers. It tracks over 100 fee types, lets you set COGS by batch and time period, and generates a clean P&L automatically. At around $19 to $29 per month, it is the most cost-effective option with serious fee coverage.
Helium 10 Profits makes sense if you already pay for Helium 10 for keyword research or listing optimization. Adding profit tracking inside the same platform keeps your workflow consolidated, though it is not as granular as Sellerboard on the fee side.
InventoryLab is built specifically for arbitrage and wholesale sellers who need to track purchase cost at the batch level and tie inventory lots directly to profit calculations. Its accounting module handles this better than most general-purpose tools.
Nova Analytics targets agencies and aggregators managing multiple Seller Central accounts. Its 30-minute data refresh and native multi-account P&L consolidation are the main differentiators. For a single-brand seller it may be more than needed, but for anyone running five or more stores it is hard to replace.
Method 4: Real-Time Inventory and Sales Monitoring
Standard profit tools show you what happened. Real-time monitoring tells you what is happening now, which matters during peak periods when a stockout or a pricing error can cost days of ranking.
NeonPanel combines sales analytics with live supply chain data, so sellers see margin and inventory status in one view rather than toggling between platforms. Its Amazon inventory management layer monitors stock movement through the fulfillment pipeline as it happens, flagging supply chain gaps before they turn into stockouts. During Q4 or Prime Day events, that kind of visibility is the difference between catching a problem in an hour versus discovering it the next morning.
The distinction from standard tracking tools: NeonPanel is not a dashboard on top of Seller Central data. It is a unified operating system that reconciles Amazon settlements, FBA and AWD shipment economics, landed cost, and true FIFO COGS into a single ledger — then posts it directly to QuickBooks or Xero. Revenue figures tie to accounting. Inventory values tie to cost. The data your operations team uses and the data your finance team signs off on are the same data.
Key Metrics to Watch
Regardless of which method or tool you use, these are the numbers worth monitoring consistently when tracking Amazon sales:
- SKU-level net profit — This is the single most important figure. Account-level averages can mask products that are actively losing money.
- ACoS and TACoS — These measure advertising efficiency. ACoS covers ad-attributed revenue only. TACoS divides ad spend by total revenue including organic, which gives a clearer picture of how dependent the business is on paid traffic.
- Sell-through rate and aged inventory — These directly affect storage fees. Products sitting past 180 days trigger long-term storage charges that quietly erode margins on slow movers.
- Return rate by ASIN — Returns carry processing fees, refund administration costs, and unsellable inventory losses on top of the lost sale itself. A high return rate on a single ASIN is often the first signal of a listing or product quality gap.
For a deeper look at the automation layer behind these metrics — including how sellers use velocity data and replenishment signals together — see Automating Amazon Inventory Forecasting: Smart Reordering Made Simple.
Choosing the Right Approach
No single method fits every seller. A useful framework: native reports and spreadsheets work well under $20,000 to $30,000 in monthly revenue when the catalog is manageable. Dedicated Amazon sales tracking software pays for itself quickly above that threshold by saving hours of manual work and catching fee errors that spreadsheets miss. Real-time monitoring adds the most value for high-volume sellers and those running aggressive promotional calendars where inventory and ranking are tightly linked.
The best setup is usually a combination: a dedicated profit tool for day-to-day margin visibility, Seller Central reports for quick reference, and real-time tracking layered in for operational awareness during critical selling periods.
Where sellers consistently hit a ceiling is in accounting reconciliation. Tools that track revenue and estimated profit do not automatically sync to QuickBooks or Xero. That creates a split between operational data and financial records that adds hours to every close cycle and makes audit preparation unreliable. For a look at how leading Amazon sellers address this, see Top Automation Solutions for Amazon Sellers: What Actually Works.
Amazon Sales Tracking: What to Automate First
Once sales volume increases, the main problem is no longer access to Amazon data but keeping that data current without repeated manual exports. Automation is most useful for the tasks that affect daily decisions and are easy to miss when handled manually.
Prioritize automation in this order:
- Sales and order data — keep units sold, revenue, refunds, and order activity updated without repeated Seller Central exports.
- Fees and costs — capture referral fees, FBA charges, advertising spend, and other selling costs so profitability does not depend on manual calculations.
- Inventory signals — connect sales velocity with current stock levels to identify products approaching a reorder point.
- Profit reporting — combine revenue with actual product costs instead of relying on sales totals alone.
The goal is not to automate every report. It is to remove repetitive data collection while keeping the figures used for inventory, pricing, and profitability decisions consistent.
Beyond Tracking: Full Operational Visibility
Sales tracking answers one question: what did we sell? A unified operating system answers the full set: what did we sell, at what actual margin, against what inventory cost, and does it match what our accountant sees?
NeonPanel is built for sellers who have outgrown tracking tools and need all of those answers in one place. Its core capabilities go well beyond sales monitoring:
- Accurate COGS via true FIFO — landed costs are allocated to each receipt batch at the shipment level and consumed in FIFO order, so margin figures reflect what was actually paid for the units that actually sold. See how Landed Cost & FIFO COGS works →
- FBA and AWD supply chain visibility — shipment-level tracking across the fulfillment pipeline, with inventory status, in-transit quantities, and storage cost exposure visible in one view. Explore Amazon Inventory Management →
- Automated accounting sync — settlements, fees, refunds, and COGS post directly to QuickBooks Online or Xero with no manual journal entries. Amazon to QuickBooks and Amazon to Xero are both fully supported.
- Multi-channel P&L on one ledger — Amazon, Shopify, and TikTok Shop data unified in a single financial ledger your operations and finance teams can both trust. See NeonPanel's Amazon accounting layer →
Ready to go beyond sales tracking and see your real Amazon economics?
NeonPanel gives you accurate COGS, live inventory visibility, and automated accounting in one unified platform — no spreadsheets, no manual reconciliation, no lag between what happened and what your books say. Explore NeonPanel for Amazon Sellers →
Further reading: Best Tools for Amazon Seller Analytics · Amazon Seller Bookkeeping Guide · Amazon Seller Automation Explained
FAQ
⌃ How do I track Amazon sales accurately?
You can track Amazon sales through Seller Central reports, spreadsheets, or dedicated sales tracking software. For reliable results, review revenue together with units sold, refunds, fees, and other transaction data.
⌃ How do I track Amazon product sales by ASIN?
Seller Central Business Reports provide product-level data by ASIN. This allows sellers to compare units ordered, sales revenue, and other performance metrics for individual products.
⌃ What is the best way to track sales on Amazon?
The best approach depends on the size of your catalog and reporting needs. Seller Central reports work well for basic tracking, while spreadsheets or dedicated software can provide more detailed analysis and automation.
⌃ Can I track Amazon sales for free?
Yes. Amazon provides sales and performance reports through Seller Central at no additional software cost. Sellers can also export this information to spreadsheets for further analysis.
⌃ How often should I track Amazon sales?
The right frequency depends on sales volume. Smaller sellers may review performance weekly, while businesses with higher order volumes may need daily monitoring of sales, fees, inventory, and profitability.
⌃ Does Amazon have a sales tracking tool?
Yes. Seller Central includes several reports for monitoring orders, product sales, payments, and business performance. Sellers with more complex reporting requirements can use dedicated Amazon sales tracking software.