

In this article What Are Amazon Seller Fees? How Much Are Amazon Fees for Sellers? Amazon FBA Fees...
In this article
- What Is an Amazon Seller Sales Report?
- Which Amazon Sales Report Should You Use?
- How to Get Amazon Sales Report in Seller Central
- How to Download Sales Report from Amazon Seller Central
- Amazon Seller Central Sales Report: Key Metrics to Analyze
- How to Analyze Amazon Sales Data Step by Step
- Amazon Daily Sales Report vs. Amazon Monthly Sales Report
- Amazon FBA Sales Report: What FBA Sellers Need to Add
- Sales Reports vs. Payments and Settlement Data
- How to Build a Useful Amazon Seller Sales Analysis
- Amazon Sales Report Software vs. Manual CSV Analysis
- How NeonPanel Turns Amazon Sales Data into Profitability Data
- How Often Should You Review Amazon Sales Reports?
- FAQ
Seller Central contains several reports that can answer different versions of the question “How are my sales doing?” Business Reports show ordered sales, traffic, and conversion. Payments reports explain financial transactions and disbursements. Advertising and FBA reports add costs and operational context.
That distinction matters because an order-based sales number is not the same as a bank deposit, and neither number is automatically profit. A useful reporting process starts with the right dataset for the decision, then combines sales information with fees, returns, advertising, and COGS when financial performance is the goal.
This guide shows where to find Amazon sales data, how to download it, which metrics deserve attention, and how to turn daily or monthly exports into decisions about traffic, conversion, inventory, and profitability.
What Is an Amazon Seller Sales Report?
An Amazon seller sales report is a dashboard or export used to measure order activity and product performance. In Seller Central, Business Reports are the usual starting point because they combine ordered product sales with units, sessions, page views, conversion-related metrics, and Featured Offer data.
The term Amazon sales report can also refer more broadly to order, payment, advertising, or fulfillment data. These datasets use different events and timing rules. Choose a source based on the question you need to answer rather than expecting one file to represent revenue, cash, fees, and profit at the same time.
For ongoing performance analysis, the most useful view is usually Sales and Traffic with an ASIN- or child-item breakdown. This type of Amazon sales data helps sellers separate a traffic problem from a conversion problem and identify which products are driving the account-level change.
Which Amazon Sales Report Should You Use?
Seller Central has overlapping reporting areas, so the right choice depends on the decision. A Business Report answers “What was ordered and how did listings perform?” A Payments report answers “What financial transactions and disbursements were recorded?” Advertising reports answer “What did paid traffic cost and produce?”
| Report / data source | Best for | Typical fields |
|---|---|---|
| Sales Dashboard / Business Reports | Account trend monitoring | Ordered product sales, units, date trends |
| Sales and Traffic by ASIN or child item | Product diagnosis | Sessions, page views, units ordered, unit session %, Featured Offer %, ordered sales |
| Payments / transaction data | Fees, refunds, adjustments, disbursements | Transaction amounts, fees, refunds, reserves, payout timing |
| Advertising reports | Paid acquisition performance | Spend, clicks, attributed sales, ACoS/ROAS fields |
| FBA inventory / fulfillment reports | Operational context | Inventory, returns, removals, reimbursements, fulfillment events |
An Amazon seller central sales report should therefore be interpreted as a performance source, not a complete income statement. If a seller needs profit by SKU, the sales information must be combined with fees, advertising, returns, COGS, and other business costs.
For broader Amazon seller reporting, it is useful to maintain separate datasets for sales, advertising, inventory, and accounting rather than trying to force every metric into one report.
How to Get Amazon Sales Report in Seller Central
If your question is how to get amazon sales report, start in Seller Central under Reports > Business Reports. Amazon’s seller tools provide the Sales Dashboard and downloadable sales and traffic information through this reporting area.
- Open Seller Central and choose Reports > Business Reports.
- Select the Sales Dashboard for an account-level view, or open a Sales and Traffic report for a more detailed product breakdown.
- Choose the date range. For diagnosis, compare the same weekday or a comparable prior period instead of looking at one isolated day.
- Apply available filters such as fulfillment channel, marketplace, or product grouping when the report supports them.
- For product analysis, use a child-item or ASIN-level view so sessions, ordered units, conversion, and sales can be tied to the listing that created them.
For sellers searching how to get sales report on Amazon seller central, the important detail is that there is no single universal report. Start with Business Reports for ordered sales and listing performance, then move to Payments, Advertising, or Fulfillment reports when the question changes.
A query such as sales report Amazon seller central often leads to the same Business Reports workflow, but menu labels and available fields can change over time. Before publishing internal instructions or automating an export, verify the current US Seller Central interface and Amazon report documentation.
How to Download Sales Report from Amazon Seller Central
The practical answer to how to download sales reports from amazon seller central is to open the required Business Report, set the date range and filters, then use the Download (.csv) option where available. Amazon also allows selected rows or the full table to be downloaded on supported Business Reports pages.
- Confirm the report type before downloading. A sales and traffic export is not interchangeable with a settlement or transaction export.
- Set the date range and filters first so the CSV reflects the scope you intend to analyze.
- Use Show/Hide Columns or similar field controls when available to include the metrics needed for the analysis.
- Download the CSV and keep the raw file unchanged. Create a working copy for calculations so you always have an audit trail back to the source.
- Record marketplace, timezone, report type, export date, and date basis in the workbook or data model. This prevents silent mismatches later.
For recurring Amazon sales tracking, saving raw exports by period is more useful than repeatedly overwriting one spreadsheet. It allows trend analysis, explains historical changes when listings or prices move, and provides evidence when a financial or operational metric needs to be reconciled.
Amazon Seller Central Sales Report: Key Metrics to Analyze
The value of a report is not the number of columns it contains. Focus first on a small set of measures that explain the sales funnel: demand reaching the listing, the listing’s ability to convert, and the number and value of ordered units.
| Metric | What it tells you | How to use it |
|---|---|---|
| Ordered Product Sales | Value of products ordered in the selected scope | Track revenue trend by account or ASIN |
| Units Ordered | Number of units ordered | Separate unit volume from price effects |
| Sessions | Visits to the detail page under Amazon’s reporting definition | Diagnose traffic changes |
| Page Views | Detail-page views, including repeat views | Compare engagement and traffic intensity |
| Unit Session Percentage | Units ordered relative to sessions | Monitor conversion behavior |
| Featured Offer Percentage | Share of eligible page views where your offer held the Featured Offer | Investigate sales loss caused by offer competitiveness |
These metrics form the basis of Amazon sales analytics. Do not read any one metric in isolation.
If ordered sales fall while sessions remain stable, check conversion, price, reviews, listing content, and Featured Offer share. If conversion stays stable while sessions drop, the problem is more likely traffic, visibility, advertising, seasonality, or demand.
How to Analyze Amazon Sales Data Step by Step
- Start with the account trend. Compare ordered product sales and units against the previous comparable period.
- Break the change down by ASIN or child item. Rank products by absolute sales change, not only by percentage change.
- Split traffic from conversion. Compare sessions with unit session percentage to see whether the issue is discovery or purchase behavior.
- Check Featured Offer percentage where relevant. A lower share can suppress orders even when the product page still receives traffic.
- Add price and promotion context. Revenue can change because units changed, price changed, or both.
- Add advertising context. Compare total sales with ad-attributed sales and spend to understand whether growth depends on paid traffic.
- Add inventory context. Stockouts and low available inventory can create artificial demand signals and distort the apparent sales trend.
- For profitability decisions, join the sales data with fees, returns, COGS, and operating costs instead of calling ordered sales “profit.”
A Simple Diagnostic Matrix
| Sessions | Conversion | Likely interpretation | First checks |
|---|---|---|---|
| Down | Stable | Traffic or visibility problem | Ads, organic rank, seasonality, inventory, category demand |
| Stable | Down | Conversion problem | Price, reviews, images, content, offer eligibility |
| Up | Down | Traffic quality changed | Search terms, campaign mix, promotions, listing relevance |
| Up | Up | Healthy growth signal | Inventory capacity, margin, ad efficiency, reorder plan |
This framework prevents a common mistake: reacting to lower sales with more advertising before checking whether the listing is converting. The same sales decline can require completely different action depending on what happened to sessions and conversion.
Amazon Daily Sales Report vs. Amazon Monthly Sales Report
An Amazon daily sales report is best for monitoring abrupt changes, promotions, stockouts, advertising effects, listing problems, or Featured Offer losses. Daily data is noisy, so compare like-for-like weekdays and avoid changing strategy because of one unusual date.
An Amazon monthly sales report is better for management reporting, seasonality, SKU mix, inventory planning, and month-end analysis. Monthly views reduce day-to-day noise, but they should still be segmented by marketplace and product so one strong SKU does not hide weakness elsewhere.
Use both cadences. Daily monitoring finds exceptions quickly; weekly review diagnoses product-level causes; monthly review connects sales to the accounting period, inventory value, fees, returns, advertising, and cash flow.
For monthly Amazon sales analysis, compare the same marketplace, product group, and fulfillment method whenever possible. This makes period-over-period changes easier to interpret.
Amazon FBA Sales Report: What FBA Sellers Need to Add
An amazon fba sales report can show the commercial side of FBA activity, but FBA profitability requires more data. Fulfillment fees, storage, inbound costs, returns, reimbursements, removals, advertising, and COGS are not fully represented by an ordered-sales view.
- Use Business Reports for ordered sales, traffic, conversion, and ASIN performance.
- Use Payments or transaction data for fees, refunds, adjustments, reserves, and disbursement context.
- Use FBA inventory and fulfillment reports for stock movements, returns, removals, and reimbursement evidence.
- Use advertising reports for campaign spend and attributed sales.
- Use an inventory cost ledger for COGS so gross profit reflects the cost basis of the units actually sold.
A sales spike can be unprofitable if advertising or fulfillment costs rise faster than margin. Conversely, a lower-revenue SKU can contribute more profit if its fee burden, return rate, and COGS are lower.
This is why FBA sales data should be connected to inventory and financial records before it is used for margin analysis.
Sales Reports vs. Payments and Settlement Data
Business Reports are designed to analyze orders and listing performance. Payment and settlement data are designed to explain financial transactions and disbursements. The timing is different, so the totals should not be forced to match line by line for the same calendar date.
An order can be placed before it ships, a refund can occur in a later period, reserves can move between settlements, and Amazon can deduct fees or adjustments before the bank deposit. A bank deposit is therefore not the same as ordered product sales.
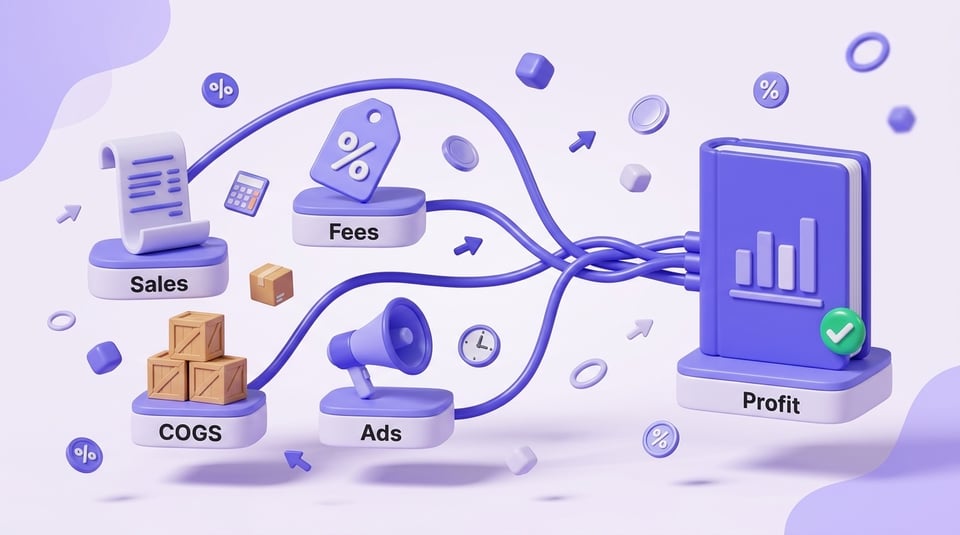
For a clean finance process, maintain a traceable chain: Order and sales data → transaction and fee data → settlement/disbursement → bank deposit → accounting entry. For product profit, add COGS and advertising to the same reporting grain.
This distinction is essential when reconciling Amazon revenue data with cash received. Revenue, transaction activity, settlement amounts, and bank deposits can belong to different reporting periods.

How to Build a Useful Amazon Seller Sales Analysis
A useful reporting file should preserve raw source data and create a separate analytical layer. Avoid manually editing imported columns. Normalize SKU, ASIN, marketplace, date, fulfillment channel, and currency first, then build pivots, formulas, or a BI model on top.
- Sales growth = (current period sales − prior period sales) / prior period sales.
- Average selling value per ordered unit = ordered product sales / units ordered.
- Unit session percentage is a conversion-oriented metric; interpret it together with sessions and order quantity behavior.
- Revenue per session = ordered product sales / sessions. It combines traffic quality, conversion, and average order value into one diagnostic measure.
- SKU contribution analysis requires sales minus Amazon fees, advertising, returns impact, and COGS. Do not label gross sales as profit.
Segment before averaging. A single account conversion rate can hide a high-converting hero product and several weak listings. The same applies to marketplaces, fulfillment methods, and time periods.
Sales by ASIN and sales by SKU are particularly useful when the account contains products with different prices, margins, advertising strategies, or inventory positions. Decision-making improves when the analysis can drill from account to product level.
For broader Amazon seller analytics, connect sales trends with advertising, inventory, pricing, and profitability metrics rather than reviewing order volume separately.
For a broader framework, see How to Track Sales on Amazon and Best Tools for Amazon Seller Analytics. These workflows help connect Seller Central exports to repeatable performance analysis.
Amazon Sales Report Software vs. Manual CSV Analysis
Manual CSV analysis works when the account is small, the reporting cadence is light, and someone owns the process. The weaknesses appear when multiple marketplaces, large SKU catalogs, recurring exports, changing schemas, and finance data must be joined every week or month.
Good Amazon sales report software should reduce repetitive importing and mapping, preserve historical data, and make exceptions visible. It should not hide the source. Users still need to know which Amazon report, date basis, currency, and business rule produced a metric.
For sellers evaluating Amazon reporting tools, the important criteria are data coverage, historical storage, automation, marketplace support, SKU-level reporting, and the ability to reconcile operational data with financial records.
| Manual spreadsheet | Connected reporting system | Human review still needed |
|---|---|---|
| Download and paste CSVs | Scheduled or API-based data ingestion | Report scope and completeness |
| Manual SKU / marketplace mapping | Reusable mapping rules | New or changed SKUs and exceptions |
| Formulas and pivots maintained by user | Standardized metrics and historical storage | Business interpretation and action |
| Separate files for fees, COGS, settlements | Joined sales and finance model | Accounting policy and period close |
Automation is most useful when reporting definitions are already clear. Automating a poorly defined metric only makes an incorrect result appear faster and more consistently.
How NeonPanel Turns Amazon Sales Data into Profitability Data
NeonPanel combines Amazon operating and financial data with inventory cost information so sellers can move beyond ordered-sales reporting toward SKU contribution analysis. Orders, fees, refunds, settlements, and inventory costs can be analyzed in one connected workflow.
For inventory accounting, NeonPanel can use purchase-order batches and FIFO cost layers so COGS follows the cost of units that ship. That avoids treating a current average product cost as the only source for historical gross-profit analysis when landed costs change between batches.
The accounting workflow can also connect to QuickBooks Online or Xero while settlements and fees remain traceable to the channel data. See Amazon accounting automation and the Amazon seller bookkeeping guide for the wider month-end process.
For businesses using FBA, What Is Amazon FBA? provides the fulfillment context, while Amazon COGS Formula explains why sales data needs an inventory cost layer before it becomes a profit report.
How Often Should You Review Amazon Sales Reports?
| Cadence | Primary purpose | Typical checks |
|---|---|---|
| Daily | Exception monitoring | Sales drop/spike, stockout, Featured Offer, promotion impact |
| Weekly | Listing and ad diagnosis | Sessions, conversion, ASIN trends, ad efficiency, inventory coverage |
| Monthly | Management and accounting review | Marketplace/SKU mix, returns, fees, COGS, settlements, margin |
| Quarterly | Strategic review | Portfolio performance, seasonality, pricing, channel and inventory strategy |
The cadence should match the action. Daily reports are valuable only if the team knows which exceptions deserve attention. Monthly reporting should be slower and more controlled because it supports financial decisions, inventory valuation, and the accounting close.
A structured Amazon sales reporting process can therefore use daily exception monitoring, weekly diagnosis, and monthly financial review without treating every reporting period as equally important.
FAQ
Amazon sales reports are most useful when each dataset has a clear job. Business Reports explain ordered sales, traffic, and conversion; Payments and FBA data explain financial and operational events; COGS and advertising complete the profitability picture. Preserve the raw data, analyze at SKU or ASIN level, and automate only after the reporting definitions are clear.